 Warning! Some of the figures are rather large.
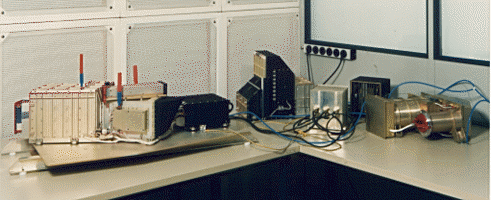
This figure shows the integrated FM2 instrument, consisting of the CTOF (right), MTOF (center back), and STOF (left) sensors, the STOF electronic box and the DPU (back right).

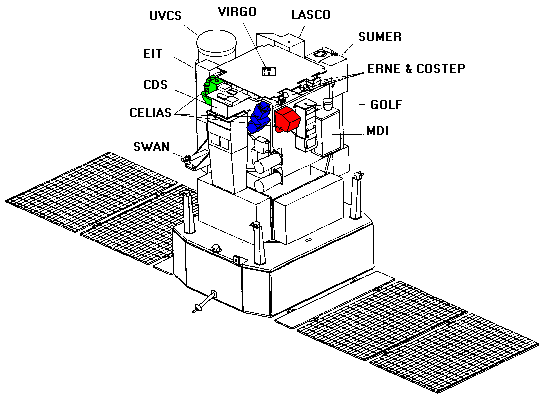
This figure shows the location of the three sensor units of the CELIAS instrument on the SOHO spacecraft: the CTOF (green), MTOF (red), and STOF (blue) sensors.
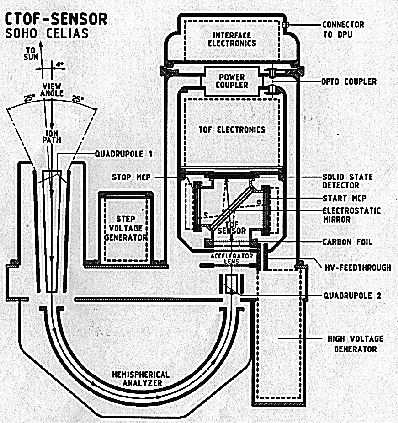
This figure shows a schematic view of the CTOF sensor.
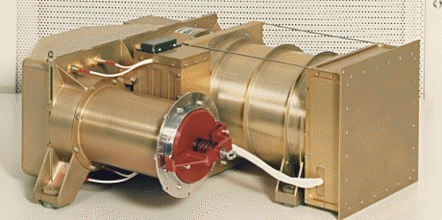
This figure shows the CTOF FM2 sensor. In the foreground you can see the entrance system consisting of a quadrupol lens (which the red tag at the entrance) and a hemisperical energy analyser in the back. Following that is the TOF section (thick cylinder in the back) and the TOF electronic.
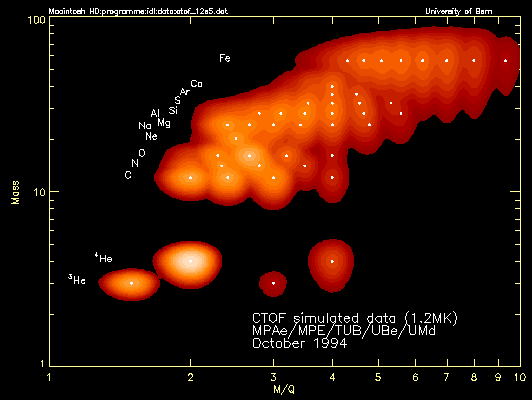
This figure shows simulated data for the CTOF sensor. It is assumed that the post acceleration between the entrance system and the TOF section is turned up to 30 kV. The transmission and the energy resolution of the entrance system are taken from calibrations of the flight model. The performance of the TOF section of the CTOF sensor is derived from measurements of the carbon foil response, the response of the solid-state-detector, and from calibrations of the flight model of the predecessor instrument. For this simulation it is assumed that the solar wind is approaching with 500 km/s and the coronal temperature is 1.2 106K. The assumed total particle density is 10cm-3. The ionization of the solar wind ions is calculated using the computer code by Arnaud and Rothenflug (1985) with the recent improvements for Fe included (Arnaud 1994). The abundances of the 15 most important elements in the solar wind are derived from measurements of solar energetic particles from Breneman and Stone (1985) for H, He, C, N, O, Ne, Na, Mg, Al, Si, S, Ar, Ca, Fe, and Ni. Furthermore, a He/O ratio of 75 (Bochsler 1986) and a H/He ratio of 25 is used. The CTOF sensor has a special protection against too high count rates, the Proton IDentifier, PID. This analog circuit prevents the CTOF digital electronic from flooding with the high count rates from protons and alpha particles, which are less interesting than the heavier ions. At nominal operations the PID is set to suppress the 4He2+ peak by 90%, the protons should be suppressed entirely, however 3He2+ should come through unattenuated. This feature is included in the simulation. The resulting data is plotted for an integration period for the 24 hours. The lowest contour line in the figure gives the one count level. The one-day integration period corresponds to a SWICS/ULYSSES measurement of more than 100 days. This improvement is due to the better duty cycle, larger geometric factor, and the closer position to the sun of the CTOF/SOHO instrument.
 Return to main document.
 Return to cover page.

This figure shows a schematic view of the MTOF sensor.
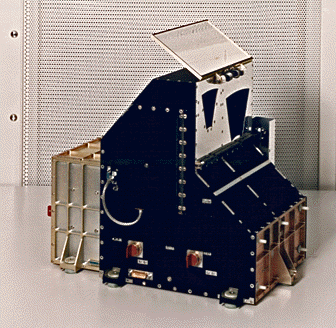
This figure shows the MTOF FM2 sensor with the cover open. There are two openings, one for the proton monitor (on the left), PM, and one for the actual MTOF sensor.
This figure shows a schematic view of the WAVE entrance system. The WAVE consists essentially of three staggered boxes of cylindrical symmetry. High transparency grounded grids cover the front of each of the boxes. The voltages on the back surfaces and on three equally spaced bands along the inside perimeters are such that in each box a constant electric field is generated. The relative sizes of the boxes and the overall geometry are chosen such that ion energy per charge ratios in the range of a factor 5 and entrance angles in the ecliptic of 20° to 70° are accepted. Accepted entrance angles out of the eccliptic are ±30°.
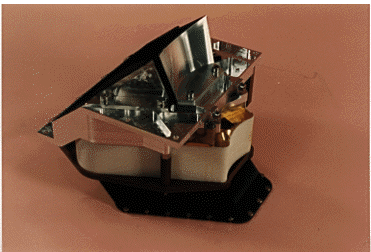
This figure shows the FM2 WAVE entrance system. The solar wind ions enter from the upper right at approximately 45°, pass the first light suppression baffle and continue into the three boxes (white ceramics) of the electrostatic deflection system. Ions with the appropriate energy per charge emerge from the exit grid, the gold platted foil to the right. At the bottom, the black structure is another light suppression baffle. The totel UV-suppression of this entrance system is 2 10-8.
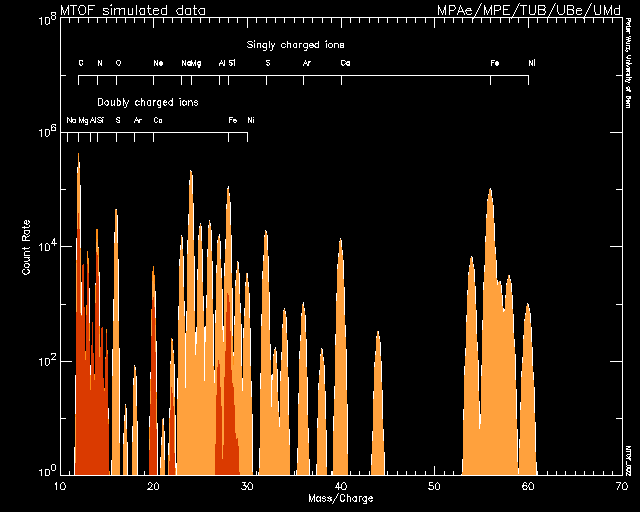
This figure shows simulated data for the MTOF sensor. It is assumed that the hyperbola of the TOF system (V-MASS) is at 30 kV and no post acceleration/deceleration between the entrance system and the V-MASS is applied. The transmission and the energy pass band of the entrance system are taken from calibrations of the flight model. The ionization efficiencies of particles passing through the carbon foil of V-MASS are taken from calibrations performed at the University of Bern. The mass resolution of the TOF section is derived from several measurements from V-MASS prototypes and the flight model of MTOF. For the simulation of the MTOF sensor response the same data set is used as for the CTOF simulation, however, the data set is enlarged by the isotopic abundances of the various elements. Thus a total of 35 different species is considered. The isotopic abundances are taken from solar system abundances given by Anders and Grevesse (1989) and from terrestrial abundance for Ca were a solar system value was not available. At nominal operations the energy pass band of the entrance system is set to transmit ions from He to Fe only. The shows the resulting mass spectrum in the mass range from 10 to 70 amu for an integration period of 24 hours. The charge exchange of particles passing the carbon foil at the entrance of the V-MASS results in mostly single ionized species, but to a smaller extent also doubly charged ions leave the carbon foil. This effect is also included in the simulation and the respective mass peaks are indicated in figure (dark red). As can be seen contributions from these doubly charged ions to the total signal occur mainly at the mass range from 11 to 15, and will be accounted for in the isotope evaluation using the carbon foil calibrations.
 Return to main document.
 Return to cover page.

This figure shows the STOF FM2 sensor. To the left is the entrance system with the sun shade in front. Following that is the TOF section. The shutter is located between the entrance system and the TOF section with the shutter actuater located at the bottom of the TOF case. The SEM is mounted on the top of the TOF section (the item with the triangular shape). In the black box in the back is the STOF electronic box.
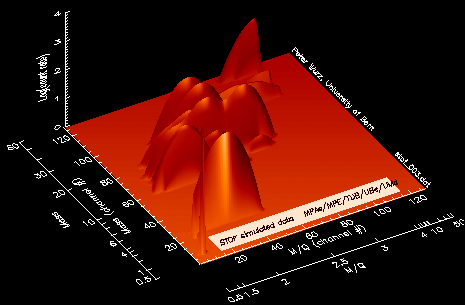
This figure shows simulated data for the STOF sensor. The transmission and the energy resolution of the entrance system are taken from calibrations of the flight model. The performance of the TOF section of the STOF sensor is derived from measurements of the carbon foil response, the response of the solid-state-detector, and from calibrations of the TOF sub-section of the instrument. For the simulation the same abundances for the various elements are used as for the CTOF simulation. However, the ionization temperature varies from element to element (Klecker 1994). For He, C, N, and O the temperature is 2 106K, for Ne up to Si it is 4 106K, for S, Ar, and Ca it is 2.1 106K, and for Fe and Ni it is 2.4 106K. Particles with an energy of 50 keV/nuc are considered in the simulation, which is on the low side of the SEP energy spectrum. The flux of the particles at this energy is 54 103/cm2-sec-sr-MeV/nuc (Klecker 1994). This corresponds to a quiet day for solar energetic particles. The resulting instrument response is shown in figure for an integration period of 24 hours. Also indicated in figure is the special data compression mechanism used for STOF. Most of the data bins are assigned to the area in mass-mass/charge space where most of the science is anticipated.
 Return to main document.
  Return to cover page.
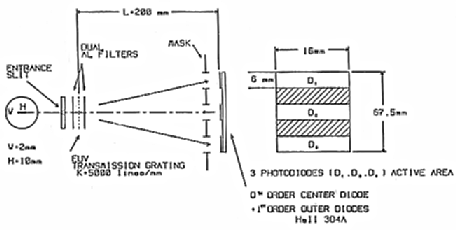
This figure shows a schematic diagram of the EUV monitor system.
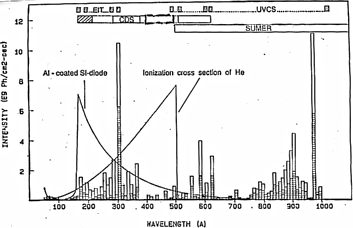
This figure shows the solar EUV flux spectrum for quiet (hatched bars) and active (open bars) conditions together with the ionization cross-section of He (in arbitrary units) and the sensitivity of an Al-coated Si-photodiode (in arbitrary units). Also shown are the wavelength ranges of the CDS, SUMER, EIT, and UVCS instruments on SOHO.
 Return to main document.
  Return to cover page.
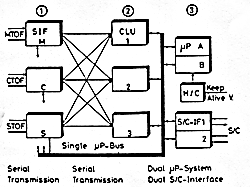 This figure shows the basic
structure of the DPU consisting of the sensor interface (SIF), the
classification unit (CLU), and the hard core (H/C).
 Return to main document.
  Return to cover page.