 |
The Charge, Element, and Isotope Analysis System CELIAS on SOHO |
|
Data page for the CELIAS instrument
The use of these data plots for public education efforts is strongly
encouraged and requires no expressed authorization. It is requested,
however, that any such use properly attributes the source of the data plots as:
Courtesy of SOHO/CELIAS/(sensor name) team. SOHO is a mission of international cooperation between ESA and NASA.
where (sensor name) is the particular sensor of the CELIAS instrument (CTOF, MTOF, STOF, PM, SEM) from which data the plots were obtained.
CELIAS online data
- Real-time solar wind data from the Proton Monitor
- Real-time energetic particle flare activity monitor
- Real-time EUV data from SEM
- SEM flux - Preliminary
- CTOF-data plotter
- SOHO-data archive
Data plots are available on the following subjects
- The CTOF Sensor
- The MTOF Sensor
- The STOF Sensor
- The Solar EUV Monitor
- CELIAS Summary Data (Key Parameter)
- Return to main document.
 Note that the data shown are preliminary and non-citable in scientific publications.
The CTOF Sensor
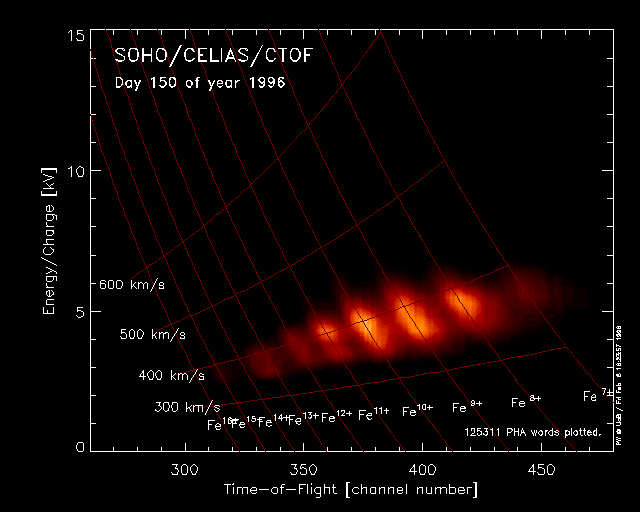
The CTOF sensor determines for every charged particle entering the sensor its mass, charge and energy. To show the ionic and elemental composition of the minor ions in the solar wind we plot a histogram of registered particles in mass and mass/charge, thus integrating over energy. A compilation of all PHA data for the time period between DOY 150 and DOY 199 of 1996 is shown in the figure below.
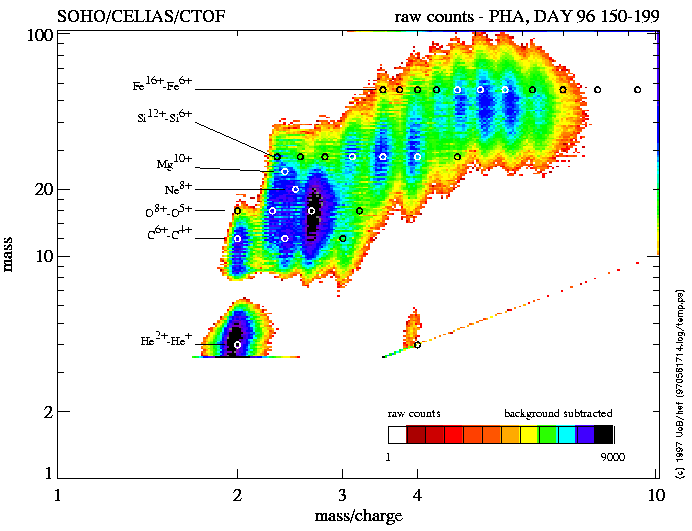
Clearly, the prominent minor ions carbon, oxygen, silicon and iron can be identified easily, with their respective charges. But even less abundant minor ions, e.g. Ne or Mg can be identified.
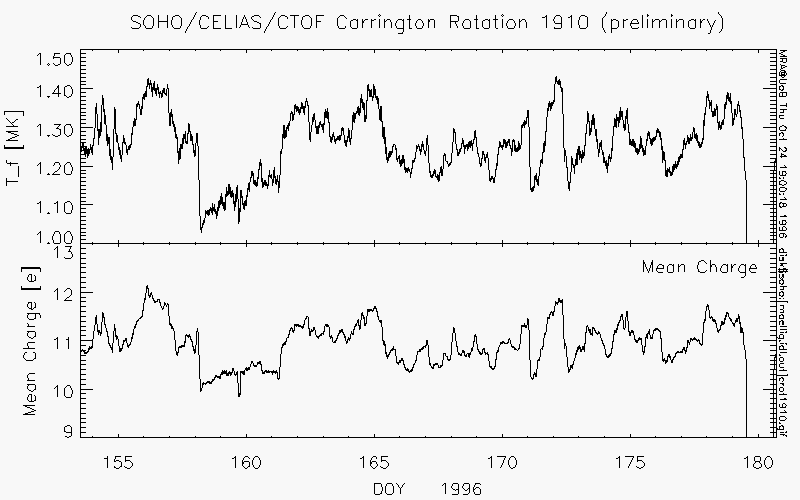
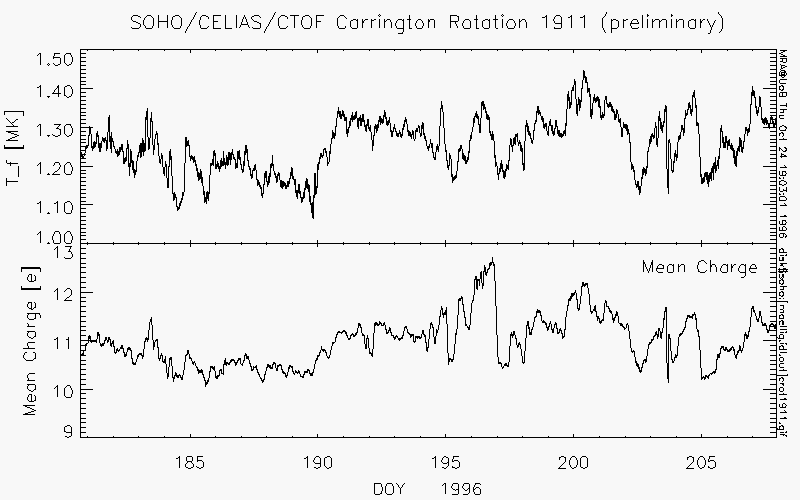
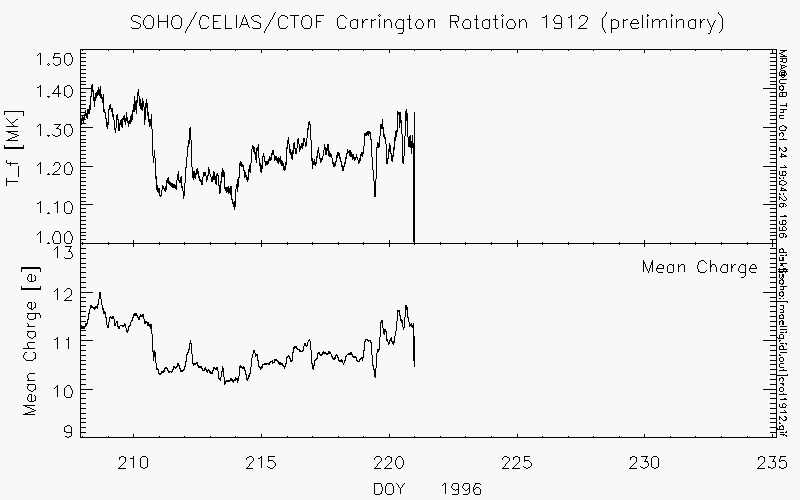
In the following panels the iron freeze-in temperature and the mean charge of the iron ion charge states are shown. They are derived from SOHO/CELIAS/CTOF data and are ordered in Carrington rotations. Both the freeze-in temperature and the mean charge are calculated from the individual iron ion densities (Fe8+ - Fe16+) and smoothed with a boxcar average of two hours width.
Iron freeze-in temperatures for CR 1910
Iron freeze-in temperatures for CR 1911
Iron freeze-in temperatures for CR 1912
Movie
Movie showing iron charge state distribution for DOY 150 until 221 of 1996 in daily images. The E/Q axis is a measure for the velocity of the iron ions. The "horizontal" lines are drawn for ion velocities of 300, 400 500, and 600 km/s from bottom to top, as indicated. The "vertical" lines give the charge state of the iron ion, as indicated. The charge state distribution is a measure of the electron temperature in the corona. If the charge state distribution is centered at high charges, the electron temperature is high and vice versa. Note the correlation of the average charge of the charge state distribution and ion velocity (pretty much the same as the solar wind proton velocity).
Here you can download
- MPEG movie (340 kBytes)
- GIF movie (1,267 kBytes)
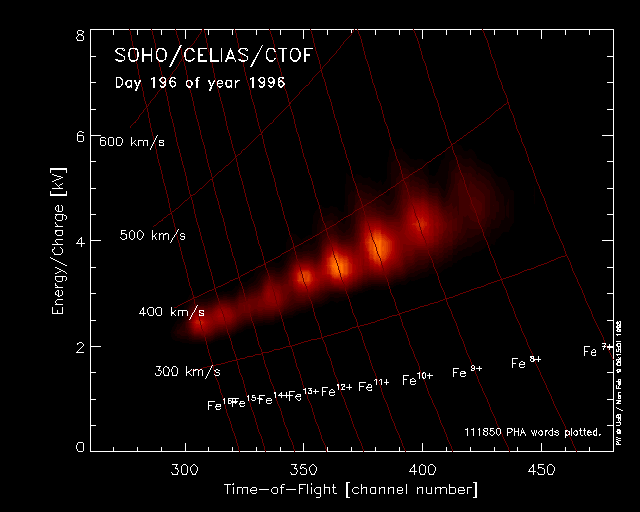
In the following picture the distribution of iron charges states is shown for DOY 196 of 1996 using CTOF PHA data. On this particular day even Fe16+ can be identified.
The MTOF Sensor
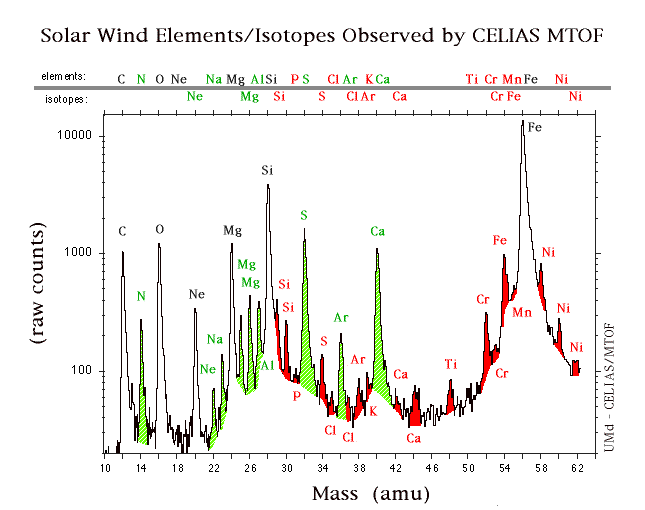
This CELIAS/MTOF spectrum was accumulated over a three day period (these values are uncorrected for efficiencies). The MTOF sensor was set in a mode that was optimized for observing solar wind species with masses above that of sulfur. This is why the peaks for Calcium (mass 40) and Iron (mass 56) are so dominant compared to, for example, Oxygen. In this color version of the figure, the peaks that are simply linedrawn are the elements commonly observed by in situ solar wind experiments: Carbon (mass 12 amu), Oxygen (mass 16 amu), Neon (mass 20), Magnesium (mass 24), Silicon (mass 28), and Iron (mass 56).
The elements and isotopes for which SOHO MTOF has given the first in situ spacecraft solar wind observations are in red. These include the Silicon isotopes (masses 29, 30), the element Phosphorus (mass 31), a Sulfur isotope (mass 34), the element Chlorine (mass 35) and its isotope (mass 37), an Argon isotope (mass 38), the Calcium isotopes (masses 42 and 44), the element Titanium (mass 48), the element Chromium (mass 52) and its isotope (mass 53), the Iron isotope (mass 54, there is also a shoulder for mass 57), the element Manganese (mass 55), the element Nickel (mass 58) and its isotopes (masses 60, 62). [For all but Argon 38, these are the first in situ solar wind observations by any means. There was a measurement of Argon 38 in the Apollo foil experiments, but it had a large uncertainty, and is not frequently quoted by the foil experimenters themselves for solar wind abundance measurements.]
The elements and isotopes that are shaded green are not observed routinely by conventional solar wind experiments. These include the element Nitrogen (mass 14), a Neon isotope (mass 22), the element Sodium (mass 23), the Magnesium isotopes (masses 25, 26), the element Aluminum (mass 27), the Sulfur element (mass 32), the Argon element (mass 36), and the Calcium element (mass 40). Measurements for Sulfur 32 have been made with the Ulysses SWICS experiment, by accumulating over several months of data, and using extensive fitting techniques (it is not really resolved from Iron and Magnesium). 22Ne and 36Ar were measured by the Apollo foil experiments. The remainder were first observed in the in situ solar wind by the MTOF prototype sensor, which was launched on WIND about 13 months before SOHO. However, MTOF has a major advantage over its prototype regarding temporal resolution, because of its higher collection power.
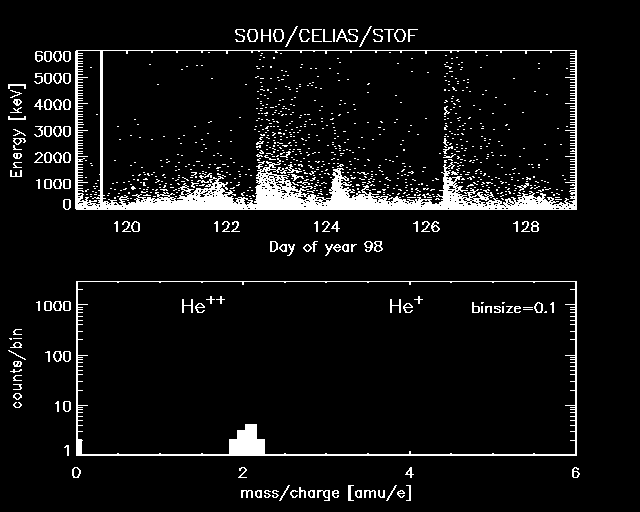
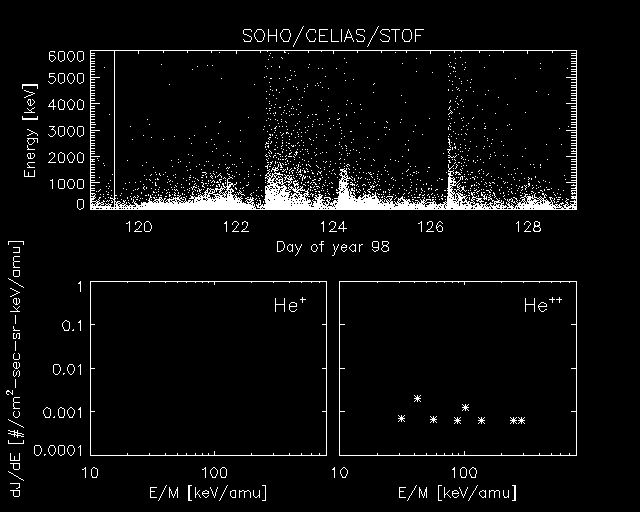
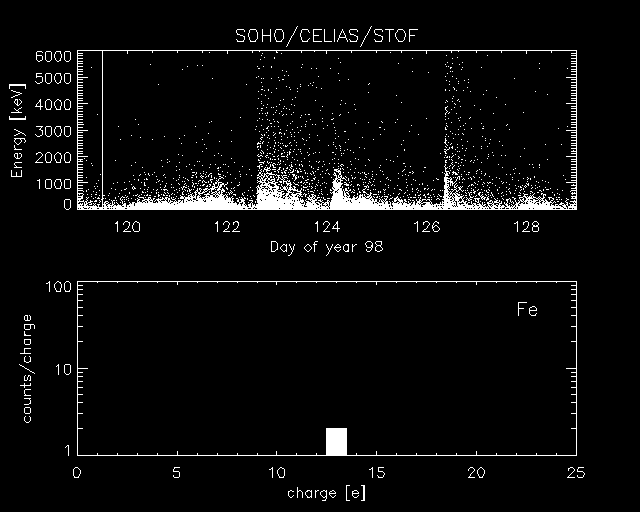
The STOF Sensor
STOF Movies
At the end of April 1998 a sequence of large CMEs was observed with SOHO/LASCO: On April 29 (DOY 119) a halo CME, on May 2 (DOY 122) a large CME, and on May 6 (DOY 126) another halo CME. With some delay these events were observed with spacecraft particle experiments of SOHO and ACE at L1. Using data from the CELIAS/STOF sensor onboard SOHO we can study for the first time the energy spectra and the charge state distribution of suprathermal particles in the energy range from 35 to 660 keV/e just above the solar wind distribution and below the low energy flare particle energies.
We made the following observations:
The He+/He++ ratio was strongly enhanced during the first halo CME. After a sudden rise it
dropped successively to approximately zero. The May 2-3 CME shows much less enrichment of He+ in the suprathermal particles. In contrast, in the
CME-related solar wind of May 2-3, 1998, a significant enhancement of He+ for an interval of more than 24 hours was found. The mean charge state
of Fe of the pre-CME time period is lower than during and after the May 2-3 CME. In the second halo CME two kinds of material can be distinguished in time:
One with higher charge states Fe and one with lower. During the time periods with shocks (DOY 121 and 124) and the first halo CME very hard spectra were
observed with spectral indices of about 2 for He++. Simultaneously the SWICS and SWIMS instruments on the Advanced Composition Explorer (ACE)
observed a most unusual elemental and charge state composition in the solar wind related to the May 2-3 CME: high and low charge states for all elements
(e.g., Fe3+ to Fe16+), an enhanced 3He/4He ratio and a prolongued He+ enhancement measured by
ACE/SWEPAM.
Here you can download some movies showing the data sets from the three CME events. Note that the fluxes are not yet fully calibrated.
- He m/q spectra (MPEG version, 539 kBytes)
- He m/q spectra (GIF version, 960 kBytes)
- He energy spectra (MPEG version, 539 kBytes)
- He energy spectra (GIF version, 1005 kBytes)
- Iron charge states (MPEG version, 540 kBytes)
- Iron charge states (GIF version, 894 kBytes)
Or all data sets in one movie:
- CME event movie (MPEG version, 543 kBytes)
The Solar EUV Monitor
CELIAS Summary Data (Key Parameter)
Summary data, also called Key Parameter data, are part of the International Solar-Terrestrial Physics ( ISTP) program key parameter data set. From the CELIAS sensor data from SEM, CTOF, STOF, and the PM are provided with 5 minute time resolution. Starting with 16 July 1996, data files in CDF format are located in the SOHO Summary Database.
The following Key Parameters are available:
Solar wind speed: The solar wind speed is derived from the data recorded with the Proton Monitor (PM).Heavy ion flux: This KP gives the integral flux of solar wind ions ranging from carbon up to iron in two energy bands. For each of the two energy bands, the ion flux is integrated over the entire energy range of the sensor. One component (data from the CTOF sensor) spans from 100 eV up to 50 keV, the other band (data from the HSTOF sensor) spans from 100 keV up to ~ 5 MeV. This Key Parameter is very helpful to identify particle events on the sun.
Solar EUV emission: This KP gives the absolute photon flux of the full solar disk in two wavelength bands as measured by the Solar EUV Monitor (SEM).The narrow band centers at the prominent and scientifically important He II 30.4 nm line (bandwidth of ± 4.0 nm), the wide band covers the absolute integral photon flux between 0.1 and 77 nm.
SOHO/CELIAS Science and Housekeeping Files
Data levels and availability
The following provides an overview of the data products of CELIAS, their availability, and documentation. CELIAS is designed to study the composition of the solar wind (SW) and of solar and interplanetary energetic particles. CELIAS data is organized by sensor:
- MTOF: measures the elementary composition of heavy ions in the solar wind.
- PM: auxiliary instrument of MTOF, measures basic parameters of proton and alpha component of the solar wind.
- CTOF: measured charge state composition of heavy ions in the solar wind (was only operational in 1996).
- H/STOF: measures suprathermal particles.
For each instrument in CELIAS data products on several levels are planned:
- Level 0: The level 0 data set is provided directly by the spacecraft. These binary files in cdf format are archived at the CAU in Kiel and in the SOHO archives.
- Level 1: The first processing step extracts all science and housekeeping data from the level 0 data into American Standard Code for Information Interchange (ASCII) format and distributes in several files for each instrument, the DPU and the respective housekeeping data. The header of each file provides basic information on the contained data products. The ASCII data is archived at the CAU. This includes onboard pre-processed science data, PHA (pulse height analysis) data and housekeeping data. For the sake of consistency with other SOHO instruments, this will be renamed as Level 0 with the planned reprocessing of the CELIAS data set.
- Level 2: Level 2 data is calibrated and is given as physical quantities. For the PM and SEM, calibrated data sets are available. This should probably be renamed Level 1.
- Level 3: These represent quantities that are derived from the level 2 data that go beyond the quantities measured with each instrument.
CELIAS Level 1 (soon to be Level 0) cdf files
A description of all variables can be found in the skeleton files or in this pdf.
An overview of the housekeeping and science data can be found below.
Housekeeping cdf files
| Instrument | File Name / Description |
|---|---|
| CTOF | SO_CEL_CTOF_HK_L0_YYYYMMDD_v01.cdf Housekeeping data including EDP counts, status information, temperatures, high voltage, SSD, sweep, and MCP settings, diagnostic voltages and currents. |
| DPU | SO_CEL_DPU_HK_L0_YYYYMMDD_v01.cdf Housekeeping data including EDP counts, commanded mode for CTOF, MTOF, and STOF, several error counters, telemetry status. |
| MTOF | SO_CEL_MTOF_HK_L0_YYYYMMDD_v01.cdf Housekeeping data including EDP counts, status information, temperatures, high voltage, SSD, sweep, and MCP settings, diagnostic voltages and currents. |
| STOF | SO_CEL_STOF_HK_L0_YYYYMMDD_v01.cdf Housekeeping data including EDP counts, status information, temperatures, high voltage, SSD, sweep, and MCP settings, diagnostic voltages and currents. |
Level 0 Science data CDF files
| Instrument | File Name / Description |
|---|---|
| CTOF | SO_CEL_CTOF_ME_L0_YYYYMMDD_v01.cdf Matrix elements. |
| CTOF | SO_CEL_CTOF_MR_L0_YYYYMMDD_v01.cdf Matrix rates. |
| CTOF | SO_CEL_CTOF_PHA_L0_YYYYMMDD_v01.cdf PHA (energy-per-charge-step, energy, time-of-flight). |
| DPU | SO_CEL_DPU_TLM_L0_YYYYMMDD_v01.cdf Telemetry data. |
| MTOF | SO_CEL_MTOF_RATES_L0_YYYYMMDD_v01.cdf Start, stop, double-coincidence rates. |
| MTOF | SO_CEL_MTOF_TOFSP1_L0_YYYYMMDD_v01.cdf Onboard time-of-flight spectra, far side of MCP. |
| MTOF | SO_CEL_MTOF_TOFSP2_L0_YYYYMMDD_v01.cdf Onboard time-of-flight spectra, near side of MCP. |
| MTOF | SO_CEL_MTOF_PHA_L0_YYYYMMDD_v01.cdf PHA (time-of-flight). |
| PM | SO_CEL_PM_RATES_L0_YYYYMMDD_v01.cdf Total rates per energy-per-charge step. |
| PM | SO_CEL_PM_RTA_L0_YYYYMMDD_v01.cdf Radial-theta array per energy-per-charge step. |
| PM | SO_CEL_PM_RSP_L0_YYYYMMDD_v01.cdf Radial spectra, vsw and alphas. |
| PM | SO_CEL_PM_TA_L0_YYYYMMDD_v01.cdf Theta array. |
| STOF | SO_CEL_STOF_DI_L0_YYYYMMDD_v01.cdf Diagnostics (event control, hybrid pixels, position thresholds). |
| STOF | SO_CEL_STOF_ME_L0_YYYYMMDD_v01.cdf Matrix elements. |
| STOF | SO_CEL_STOF_MR_L0_YYYYMMDD_v01.cdf Matrix rates. |
| STOF | SO_CEL_STOF_PHA_L0_YYYYMMDD_v01.cdf PHA (energy and time-of-flight). |
| STOF | SO_CEL_STOF_SBL_L0_YYYYMMDD_v01.cdf HSTOF/STOF cross-rejection, thresholds and position rates. |
| STOF | SO_CEL_STOF_SBH_L0_YYYYMMDD_v01.cdf HSTOF/STOF priority rates. |
| STOF | SO_CEL_STOF_SEM_L0_YYYYMMDD_v01.cdf SEM EUV rates. |


Author : Verena Heidrich-Meisner, Lars Berger, Maximilian Hecht |
Celias PI : Robert F. Wimmer-Schweingruber |
Latest Update: 2, December 2023 |